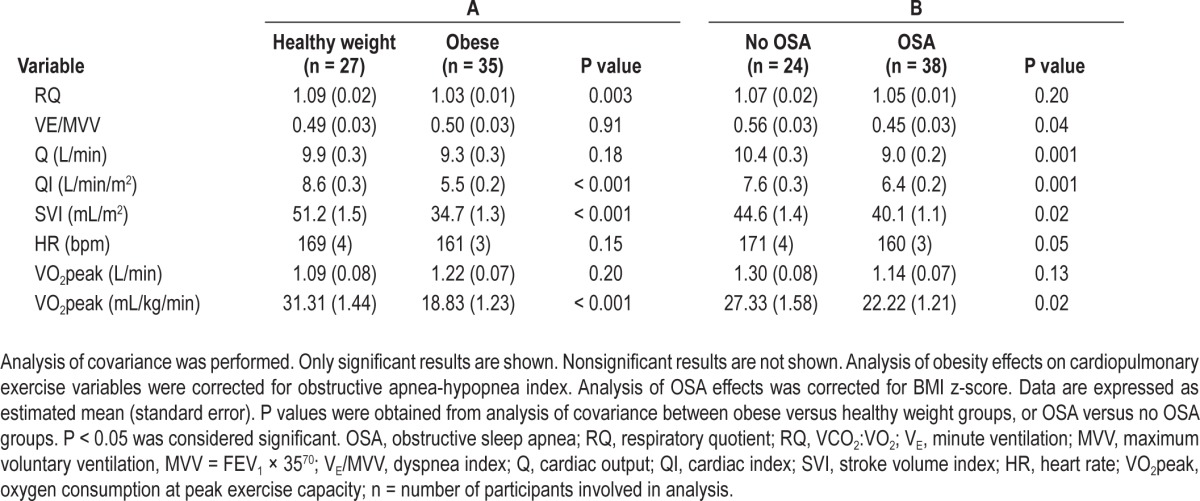
Table 4.
Cardiopulmonary function at peak exercise capacity between groups: A: healthy weight versus obese (adjusted for obstructive apnea-hypopnea index) or B: obstructive sleep apnea versus non obstructive sleep apnea (adjusted for body mass index z-score).

