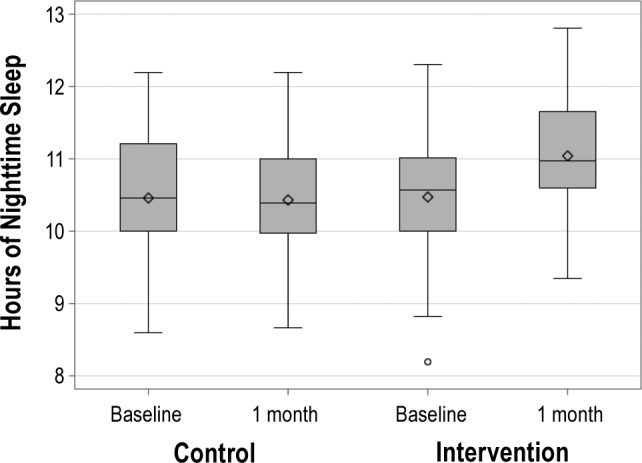
Figure 3.

Average weeknight sleep duration for the intervention and control group at baseline and 1-mo follow-up. Using a 2 × 2 analysis of variance, a significant time × treatment interaction emerged (P = 0.04). Plots show medians, means (diamonds), 25th and 75th percentiles, 10th and 90th percentiles (serifs), and outliers.
