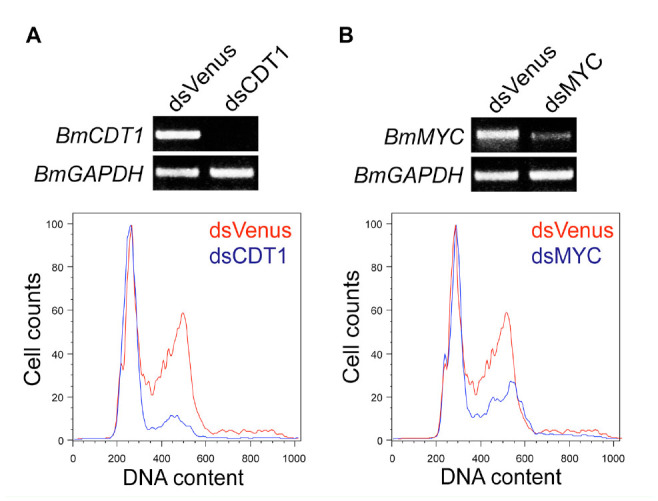
Figure 2.

Knockdown of BmCDT1 or BmMYC expression by soaking RNAi. Knockdown efficiency and cell cycle analysis for the BmCDT I (A) or BmMYC (B) depleted BmN4-SID 1 cells was performed by RT-PCR and flow cytometry, respectively. In flow cytometry analysis, the number of control cells (dsVenus treatment) is indicated by the red line, and the number of cells treated with dsRNA for the Bombyx mori gene is indicated by the blue line. High quality figures are available online.
