Figure 3.

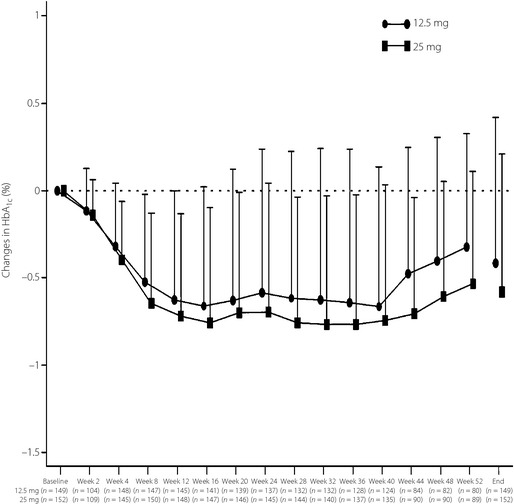
Time profiles of changes in glycated hemoglobin (HbA 1c; mean ± SD) in the alogliptin 12.5 and 25 mg groups during the course of the 52‐week clinical study (the period in which placebo was given is excluded).

Time profiles of changes in glycated hemoglobin (HbA 1c; mean ± SD) in the alogliptin 12.5 and 25 mg groups during the course of the 52‐week clinical study (the period in which placebo was given is excluded).