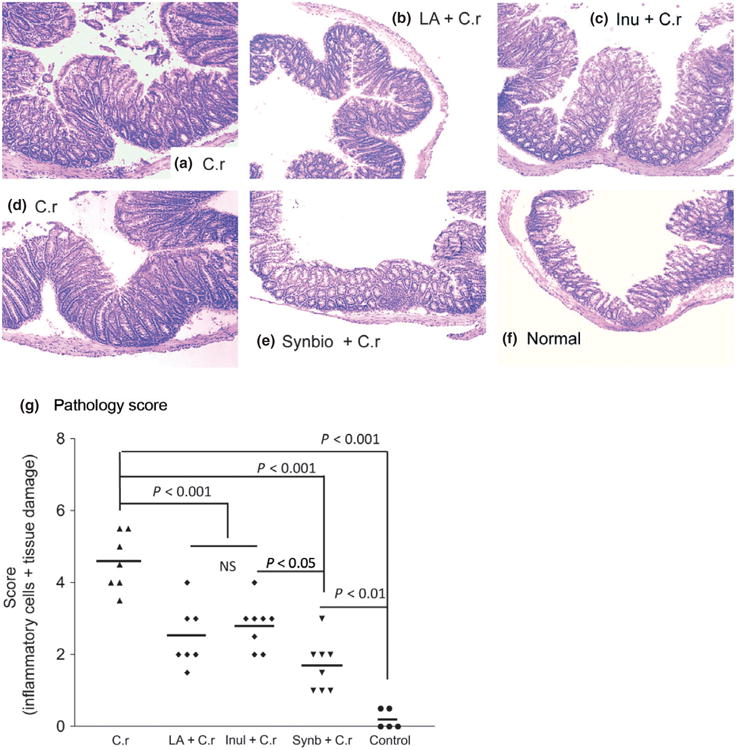
Fig. 3.

Representative histopathology of colonic tissues at 2 weeks post-Cr infection. Three independent experiments showing similar results with ≈ 7–10 mice per treatment. (a and d) Mice that were infected with Citrobacter rodentium only. (b) Mice pretreated with probiotic La and then infected with Cr. (c) Mice pretreated with prebiotic inulin and then infected with Cr. (e) Mice pretreated with synbiotic and then infected with Cr. (f) Normal mice. (g) The colonic pathology score of different groups of mice at 2 weeks after C rodentium infection. The scores were assessed by determination of inflammation and tissue damage. The figures shown are measurements of individual mice pooled from three independent experiments. The horizontal line represents the mean score of different groups. Data from the colonic pathology scores were analyzed using one-way analysis of variance (Tukey's multiple comparison test).
