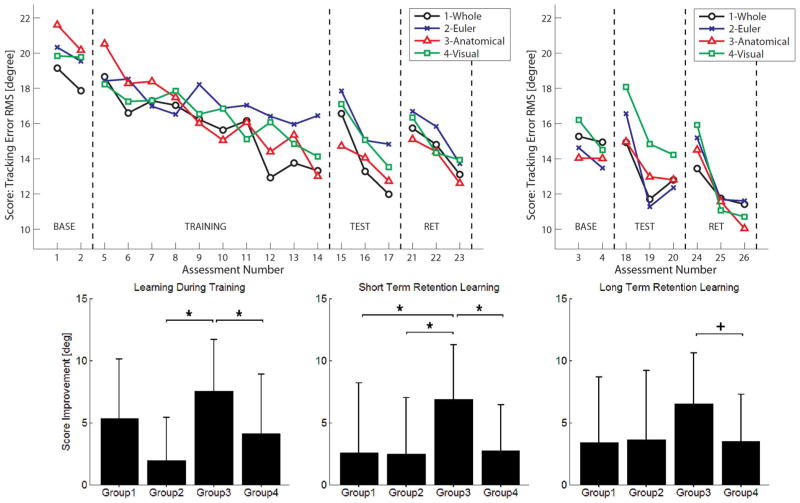
Fig. 5.
Top: Score during different training phases. The top left plot shows the assessments for the main motion. The top right shows the assessments for the transfer motion. Bottom: Amount of learning during training (assessment 5 versus 14, left), at short-term retention 5 min after training (assessment 1 versus 15, middle) and at long-term retention one week after training (assessment 1 versus 21, right). Group 1-Whole, 2-Euler, 3-Anatomical, and 4-Visual training techniques. Asterisks denote significance at p = 0.05, + denote marginal significance p < 0.1.

