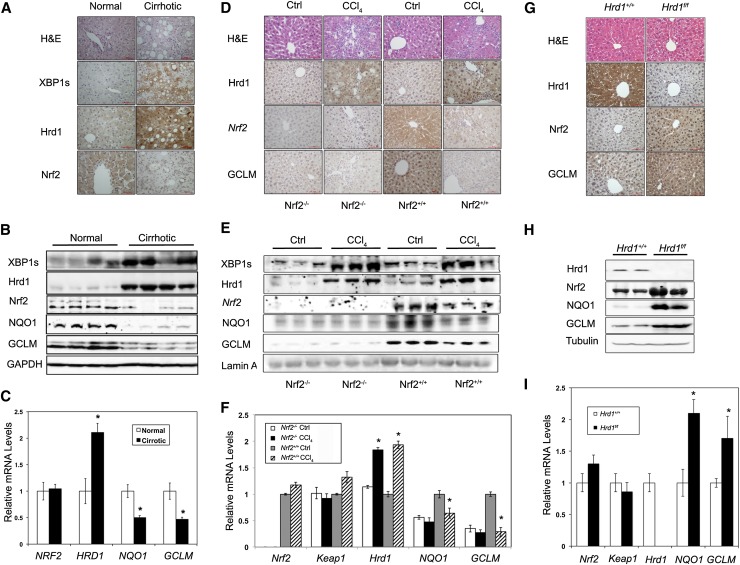
Figure 1.
The XBP1–Hrd1 arm of the ER stress pathway is up-regulated, and the Nrf2-mediated antioxidant response pathway is down-regulated in human cirrhotic liver. (A–C) Normal or cirrhotic liver tissues from patients with end-stage liver cirrhosis. (A) Representative hematoxylin and eosin (H&E) and IHC staining of XBP1s, HRD1, and NRF2 from liver tissues. (B) Expression levels of the indicated proteins detected using immunoblot analysis. (C) mRNA levels of NRF2, HRD1, NQO1, and GCLM measured by quantitative real-time PCR (qRT-PCR). (D–F) Liver tissues from control or CCl4-treated mice. (D) Representative H&E and IHC staining of Hrd1, Nrf2, and GCLM from liver tissues. (E) Expression levels of the indicated proteins detected using immunoblot analysis. (F) mRNA levels of Nrf2, Keap1, Hrd1, NQO1, and GCLM measured by qPCR. (G–I) Liver tissues from Hrd1+/+ and Hrd1f/f mice tail vein-injected with Cre-containing viruses for 5 d. (G) Representative H&E and IHC staining of Hrd1, Nrf2, and GCLM from liver tissues. (H) Expression levels of the indicated proteins detected using immunoblot analysis. (I) mRNA levels of Nrf2, Keap1, Hrd1, NQO1, and GCLM measured by qPCR. For immunoblot analysis, each lane contains a tissue lysate from an individual person (B) or mouse (E,H). For qRT-PCR, results are expressed as means ± SD; n = 4, four people per group (C); n = 4, three mice per group (F); and n = 3, three mice per group (I).

