Figure 2.
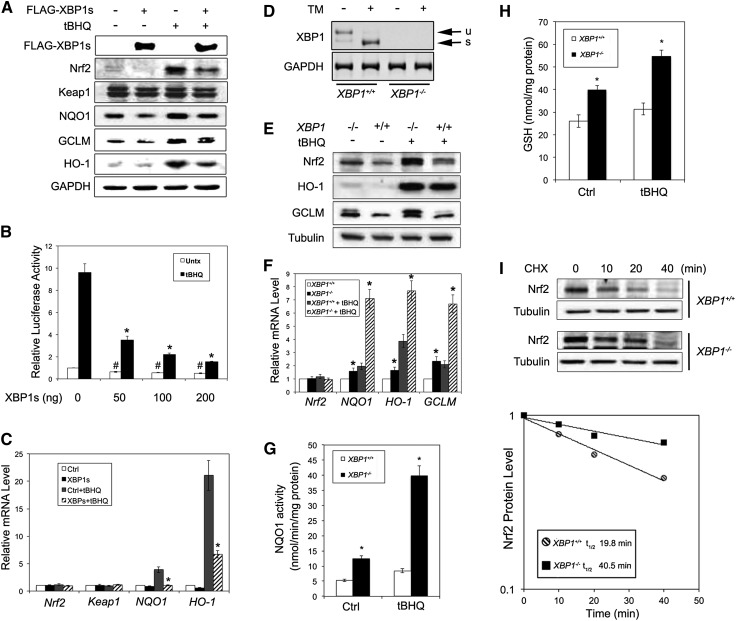
XBP1s and Nrf2 expression levels are inversely correlated. (A) Immunoblot analysis of the indicated proteins with cell lysates from HEK293T cells transfected with an empty vector or Flag-XBP1s. At 24 h post-transfection, cells were left untreated or treated with 50 μM tBHQ for 16 h. (B) Luciferase activities were measured in HEK293T cells cotransfected with NQO1-ARE-firefly luciferase and TK-Renilla luciferase along with the indicated amount of Flag-XBP1s for 36 h. Relative luciferase activities and SDs were calculated from three independent experiments (n = 3). (C) mRNA levels of Nrf2, Keap1, NQO1, and HO-1 in HEK293T cells transfected and treated as described in A (n = 3 independent experiments). (D) Splicing analysis of XBP1 mRNA (unspliced [u] and spliced [s]) was performed as described in the Materials and Methods. Total mRNA was extracted from XBP1+/+ and XBP1−/− MEF cells untreated or treated with 5 μg/mL tunicamycin for 16 h. (E–H) Protein levels of the indicated proteins (E), mRNA levels of the indicated genes (F), NQO1 activities (G), and intracellular glutathione levels (H) were measured in XBP1+/+ and XBP1−/− MEF cells left untreated or treated with 50 μM tBHQ for 16 h. (I) The Nrf2 protein half-life in XBP1+/+ and XBP1−/− MEF cells was measured in the presence of 50 μM cycloheximide at the indicated time points. Cell lysates were subjected to immunoblot analysis, with Nrf2 intensity normalized to tubulin plotted using a semilogarithmic scale.

