
Figure 1.
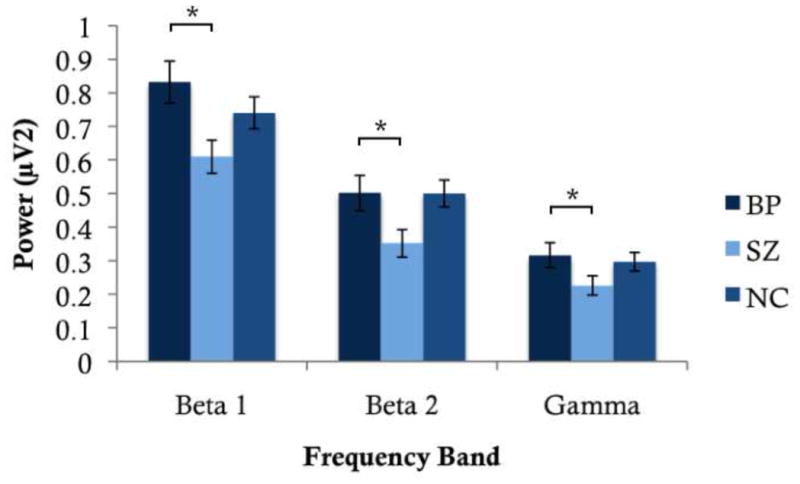
Average EEG power at Beta 1, Beta 2 and Gamma for BP, SZ, and NC. BP showed significantly greater power at all three frequency bands relative to SZ.
Official websites use .gov
A
.gov website belongs to an official
government organization in the United States.
Secure .gov websites use HTTPS
A lock (
) or https:// means you've safely
connected to the .gov website. Share sensitive
information only on official, secure websites.
Average EEG power at Beta 1, Beta 2 and Gamma for BP, SZ, and NC. BP showed significantly greater power at all three frequency bands relative to SZ.