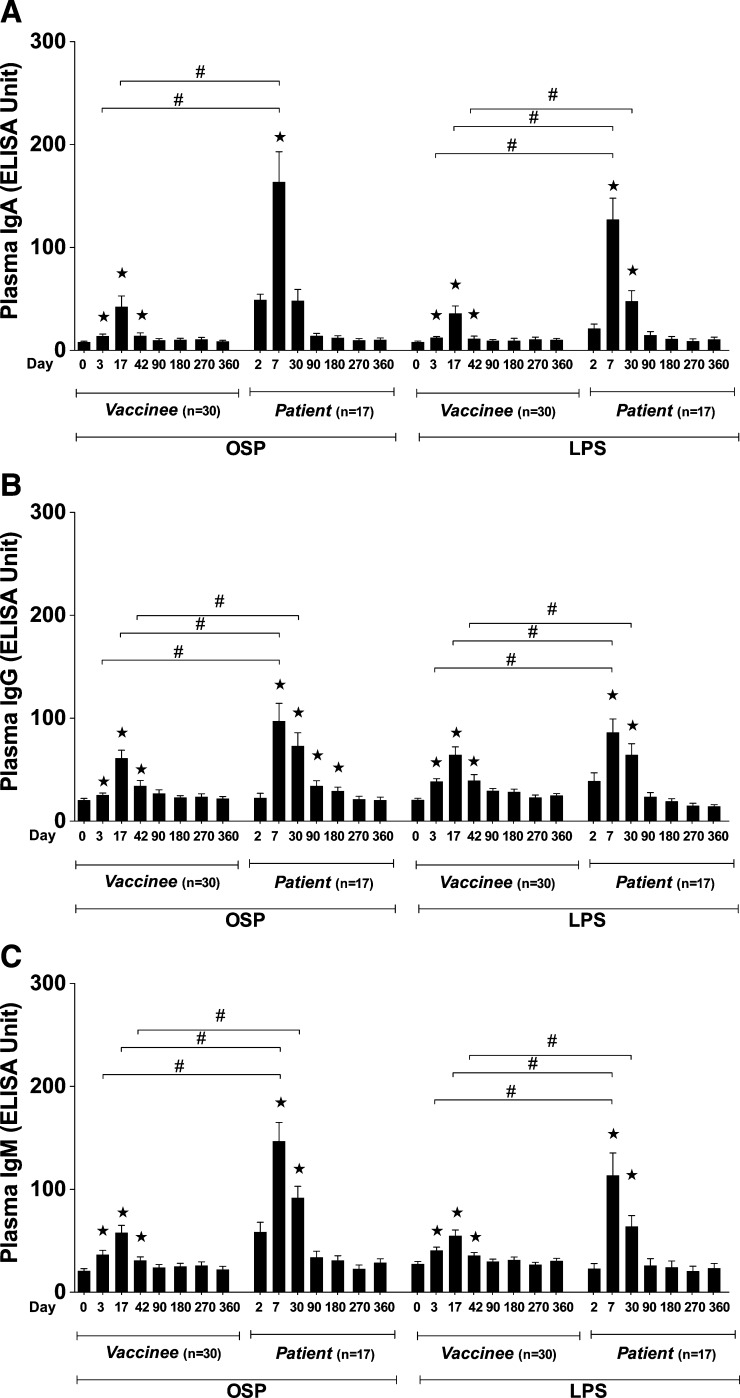
Figure 1.
Mean normalized immunoglobulin A (IgA), IgG, and IgM responses in plasma of vaccinees and patients to Ogawa OSPc:BSA (OSP, O-specific polysaccharide) and lipopolysaccharide (LPS). Asterisks indicate a statistically significant difference (P ≤ 0.05, two-tailed) from baseline (Day 0 or Day 2) levels within a particular antigen group and “#” indicates a statistically significant difference (P ≤ 0.05) between similar days in vaccinees and patients.

