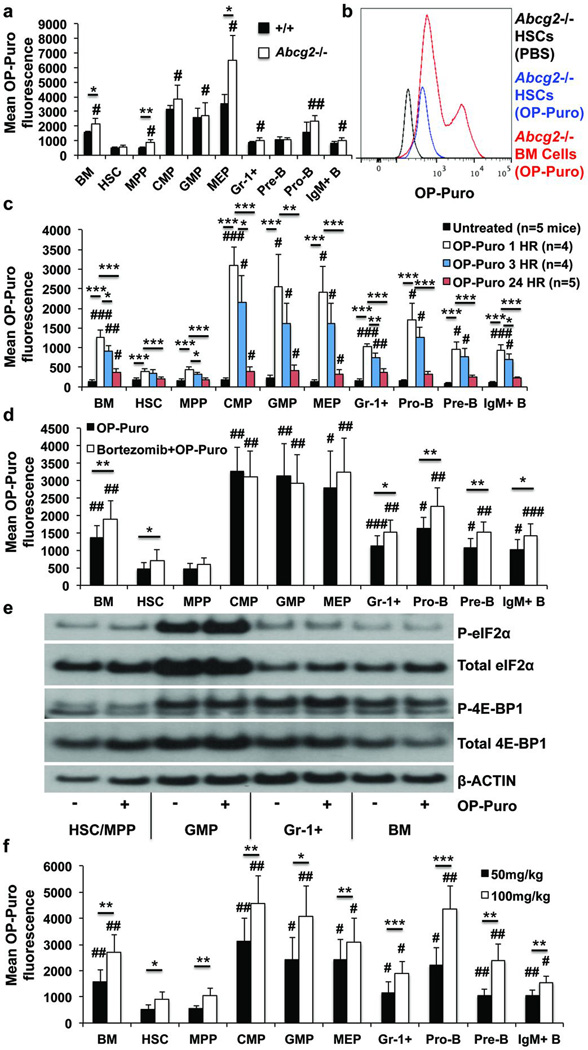
Figure 2. Lower rate of OP-Puro incorporation by HSCs does not reflect efflux or proteasomal degradation.
a,b, OP-Puro fluorescence in haematopoietic cells from Abcg2-deficient and control mice one hour after OP-Puro administration in vivo (n=4 mice from 3 experiments). c, OP-Puro fluorescence in haematopoietic cells one, three, or twenty-four hours after OP-Puro administration (n=5 experiments). d, OP-Puro fluorescence in haematopoietic cells two hours after bortezomib and one hour after OP-Puro administration in vivo (n=5 mice/treatment from 5 experiments). e, Western blots of 30,000 cells from each haematopoietic cell population from OP-Puro-treated or control mice. f, OP-Puro fluorescence in haematopoietic cells one hour after administering 50mg/kg or 100mg/kg OP-Puro (n=5 mice/dose from 5 experiments). All data represent mean±s.d. To assess the statistical significance of treatment effects within the same cells we performed two-tailed Student’s t-tests (*, p<0.05; **, p<0.01; ***, p<0.001). Differences between HSCs and other cell populations were assessed with a repeated measures one way ANOVA followed by Dunnett’s test for multiple comparisons (#, p<0.05; ##, p<0.01; ###, p<0.001).

