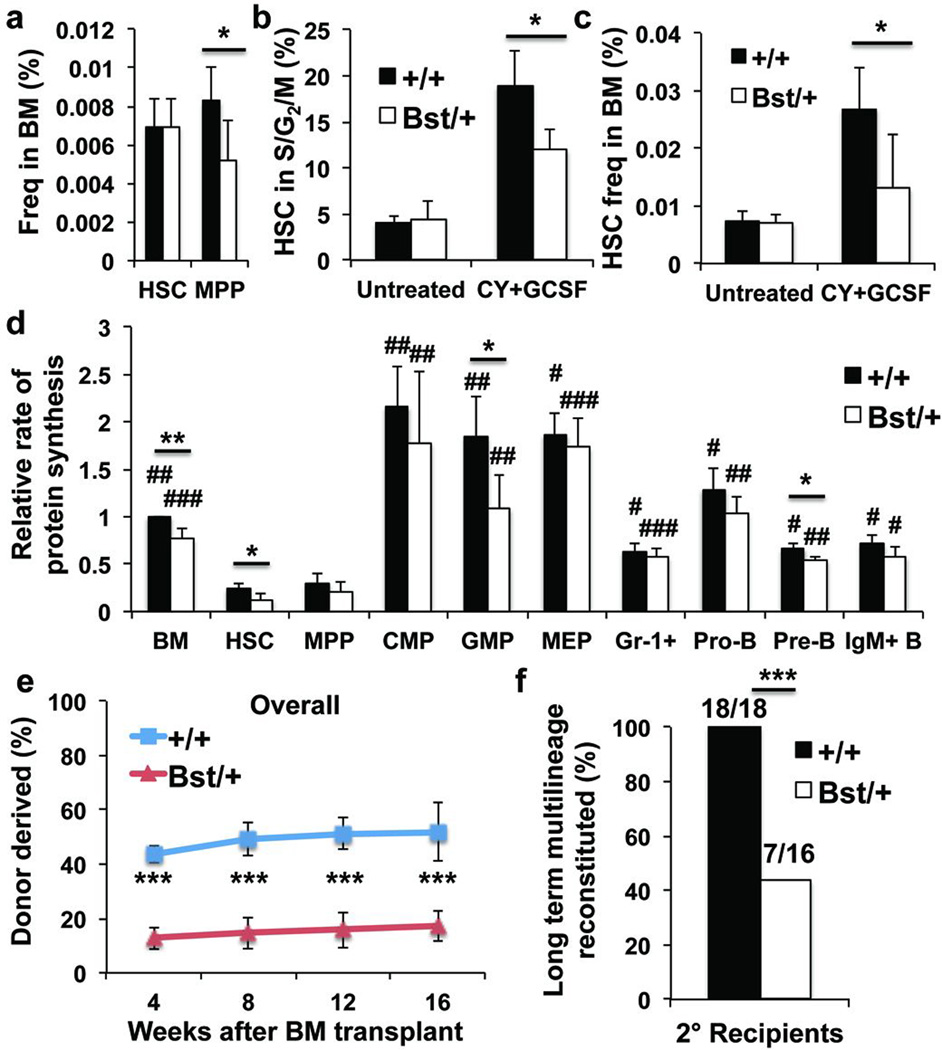
Figure 4. Rpl24Bst/+ HSCs synthesize less protein and have less capacity to reconstitute irradiated mice.
a, Frequencies of HSCs and MPPs in Rpl24Bst/+ (n=7) versus littermate control (n=6) mice (n=5 experiments). b,c Frequency of HSCs in S/G2/M (b; n=4 untreated mice/genotype, n=3 (Rpl24Bst/+) or 4 (+/+) Cy/G-CSF treated mice/genotype in 3 experiments) and frequency of HSCs in the bone marrow (c; n=6 wild-type and 7 Rpl24Bst/+ untreated mice, n=7 wild-type and 5 Rpl24Bst/+ Cy/G-CSF treated mice in 4 experiments) after treatment with Cy/G-CSF. d, Protein synthesis in haematopoietic cells based on OP-Puro incorporation in vivo (n=4 mice/genotype in 4 experiments). e, Donor cell engraftment when 5×10⁵ donor bone marrow cells were transplanted along with 5×10⁵ recipient bone marrow cells into irradiated recipient mice (n=4 experiments with a total of 17 recipients for wild-type, and 20 for Rpl24Bst/+; myeloid, B, and T engraftment are in Extended Data Figure 5k). f, The number of long-term multilineage reconstituted secondary recipients (>0.5% donor myeloid and lymphoid cells for at least 16 weeks after transplantation) after secondary transplantation of 3×10⁶ bone marrow cells from primary recipients in (e) (n=4 donors/genotype). All data represent mean±s.d. Statistical significance was assessed with two-tailed Student’s t-tests (a-e) and Fisher’s exact test (f) (*p<0.05, **p<0.01, ***p<0.001). Differences between HSCs and other cell populations (d) were assessed with a repeated measures one-way ANOVA followed by Dunnett’s test for multiple comparisons (#, p<0.05; ##, p<0.01; ###, p<0.001).

