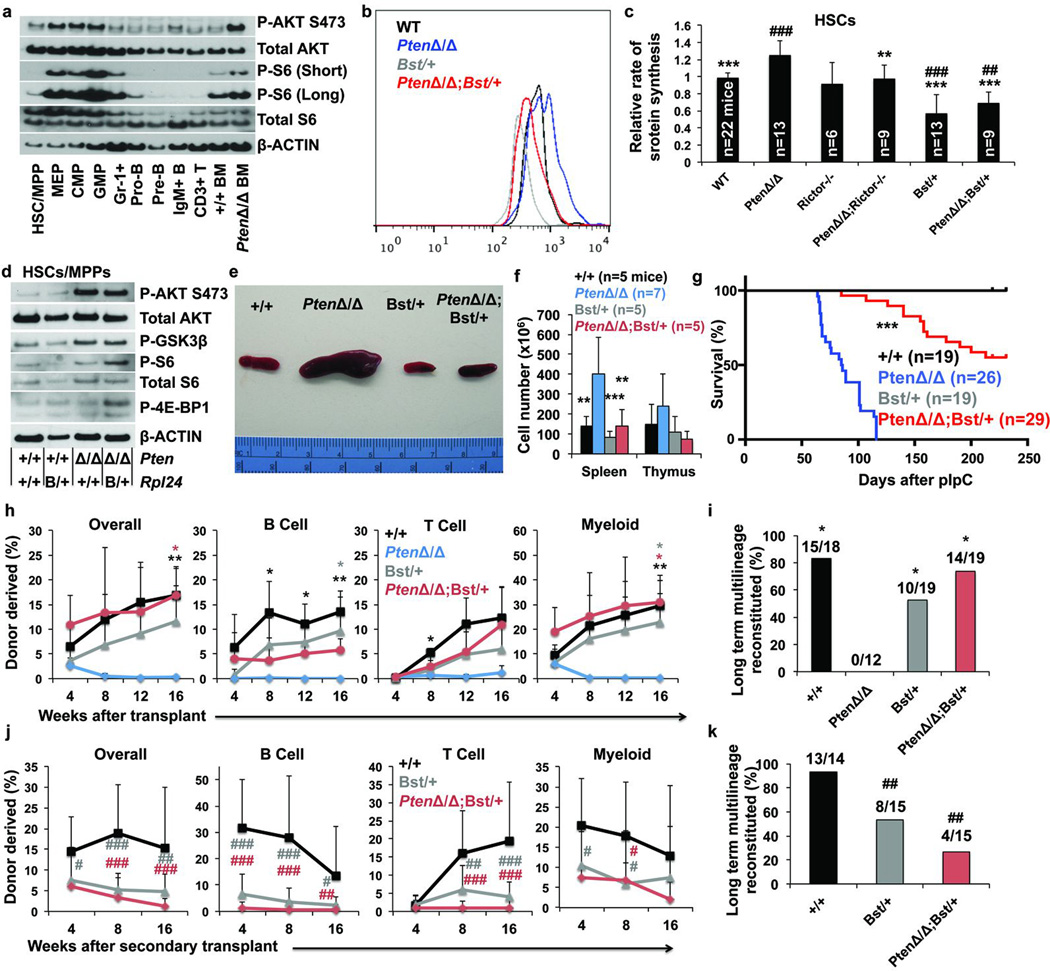
Figure 5. Rpl24Bst/+ blocks the increase in protein synthesis and restores HSC function after Pten deletion.
a, Western blots of 30,000 cells from each population. Long and short exposures for pS6 are shown. For total S6, a non-specific band is present below the specific band. Differences in β-Actin represent differences in β-Actin content per cell (1 representative blot from two experiments). b, Representative histograms of OP-Puro fluorescence in HSCs of each genotype. c, OP-Puro incorporation into HSCs of each genotype (n=15 experiments). d, Western blots of 30,000 HSCs/MPPs of the indicated genotypes (1 representative blot from two experiments). e, Representative spleens 2 weeks after pIpC administration to wild-type, Mx-1-Cre; Ptenfl/fl, Rpl24Bst/+, and Mx-1-Cre; Ptenfl/fl; Rpl24Bst/+ mice. f, Spleen and thymus cellularity (n=7 experiments). g, Time until mice had to be sacrificed due to illness after transplantation of 2×10⁶ bone marrow cells of the indicated genotypes into irradiated recipient mice. h, i, 10 donor HSCs were transplanted along with 3×10⁵ recipient bone marrow cells into irradiated recipients. Donor cell engraftment (h) and fraction of recipients that were long-term multilineage reconstituted (i; 3 experiments). j, k, Donor cell engraftment (j) and the fraction of secondary recipients that were long-term multilineage reconstituted (k) after transplantation of 3×10⁶ bone marrow cells from primary recipients in (h) (n=4 donors/genotype). All data represent mean±s.d. Differences among genotypes (c, f, h) were assessed with a one way ANOVA followed by Dunnett’s test for multiple comparisons. Statistical significance was assessed by log-rank test (g), Chi-squared tests followed by Tukey's t-tests for pairwise comparisons (i,k), or a one way ANOVA followed by Tukey’s t-tests for multiple comparisons (j). Significance was expressed relative to wild-type (#, p<0.05; ##, p<0.01; ###, p<0.001) or Pten-deficient cells (*, p<0.05; **, p<0.01; ***, p<0.001).

