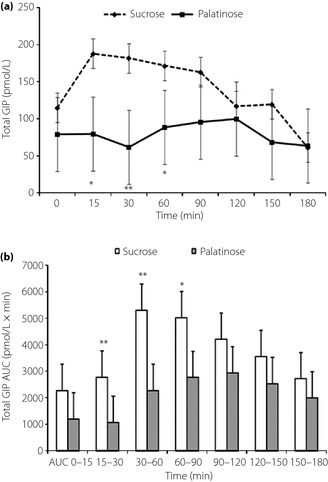
Figure 3.

(a) Change of plasma total GIP and (b) area under the curve (AUC) of plasma total glucose‐dependent insulinotropic polypeptide (GIP) after oral administration of 50 g palatinose or sucrose in 10 healthy participants. Mean ± standard deviation. *P < 0.05, **P < 0.01.
