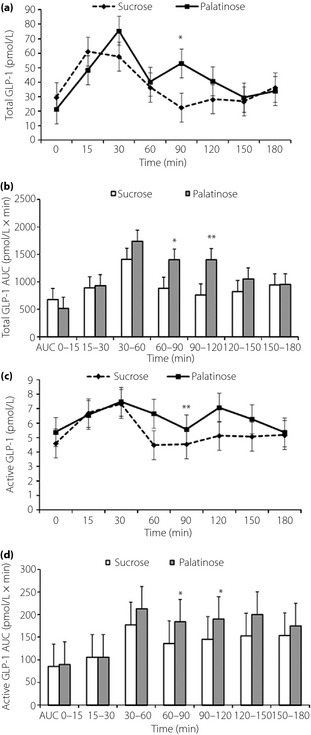
Figure 4.

(a) Change of plasma total glucagon‐like peptide‐1 (GLP‐1), (b) area under the curve (AUC) of plasma total GLP‐1, (c) plasma active GLP‐1 and (d) AUC of plasma active GLP‐1 after oral administration of 50 g palatinose or sucrose in 10 healthy participants. Mean ± standard deviation. *P < 0.05, **P < 0.01.
