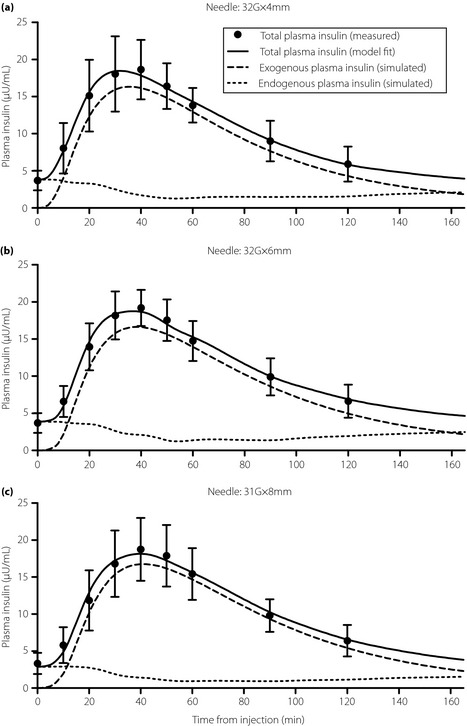
Figure 4.

Measured plasma insulin concentrations (circles; mean and standard deviation) and the model fits of total insulin (solid line). The simulated exogenous plasma insulin curves (dashed line; mean values) and of simulated endogenous plasma insulin curves (dotted line; mean values). The simulated exogenous and endogenous plasma insulin curves were generated by simulating the model using the identified parameters with insulin secretion set to 0 and the injection dose set to 0, respectively. The sum of the exogenous and endogenous curves yield the model fit of total insulin. (a) 32‐G × 4 mm (32G × 4) needle. (b) 32‐G × 6 mm (32G × 6) needle. (c) 31‐G × 8 mm (31G × 8) needle.
