Figure 1.

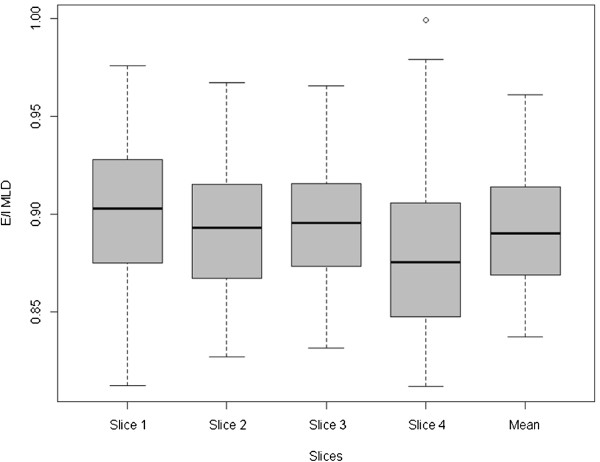
Box plots of air trapping represented by E/IMLDin 4 levels and mean of E/IMLD. Significant differences between slices were observed (p = 0.0002).

Box plots of air trapping represented by E/IMLDin 4 levels and mean of E/IMLD. Significant differences between slices were observed (p = 0.0002).