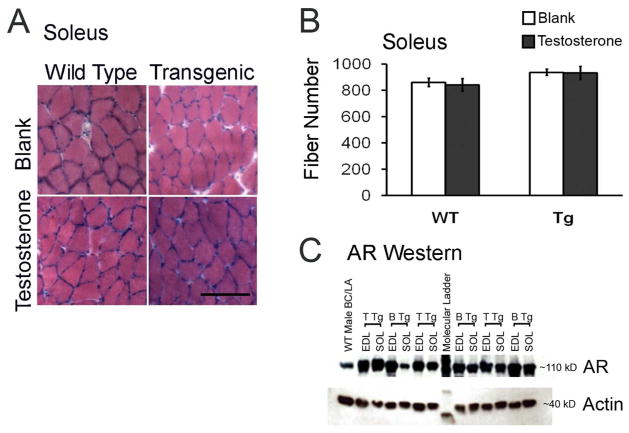
Figure 3.
Neither histopathology nor expression of the AR transgene explains the severe deficit in SOL force production of T-treated Tg mice. Cross sections of SOL muscle (scale bar = 500 μm) from Tg females after 5 days of T treatment stained with hematoxylin and eosin exhibit no signs of abnormal morphology (e.g. fiber atrophy/hypertrophy, centralized nuclei, A) nor alterations in fiber number (B) compared to the SOL from other treatment groups (N = 4–5 mice/group). Bars represent means ± standard errors of means. AR immunoblot (C) showing AR expression levels in the EDL and SOL from asymptomatic (B Tg) versus symptomatic (T Tg) mice. We find no consistent differences in AR expression (~110 kD) between EDL and SOL muscles, indicating that a difference in AR protein content between the EDL and SOL is not likely to underlie the relatively greater force deficit in the SOL compared to the EDL in T-treated Tg mice. Actin (~40 kD) loading control shows no consistent differences in protein loading between the EDL and SOL of Tg mice.

