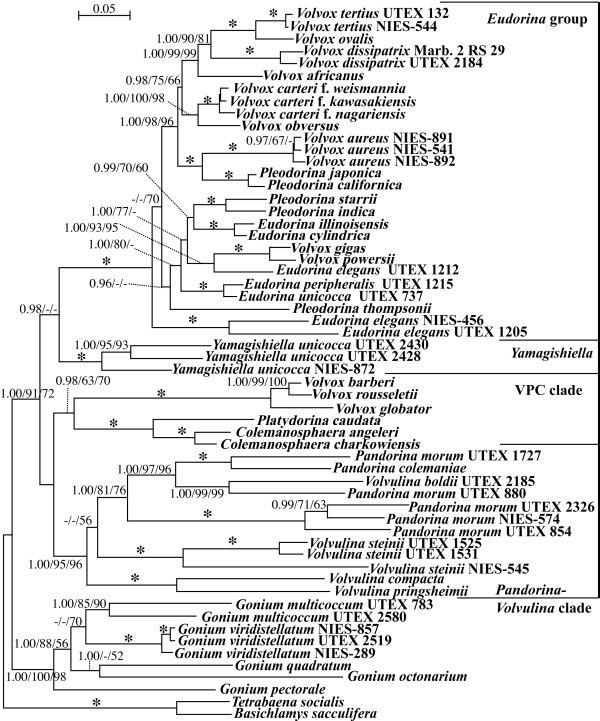
Figure 2.
Bayesian inference (BI) tree of the Volvocaceae based on the chloroplast five genes. For details of the methods, see the Methods Section. Branch lengths are proportional to the genetic distances, which are indicated by the scale bar above the tree. Numbers on the left, middle, or right side at the branches represent posterior probabilities (PP) of BI (≥0.95), bootstrap values (≥50%, based on 1,000 replicates) obtained with the maximum likelihood and maximum parsimony analyses, respectively. Asterisks at the branches indicate 1.00 PP and 100% bootstrap values by the two methods.

