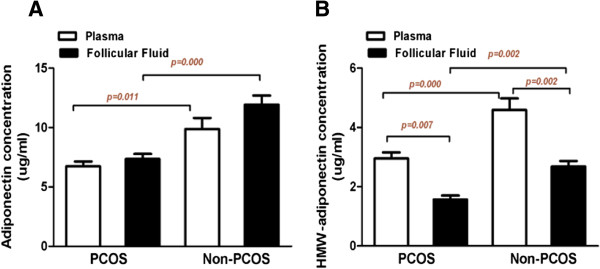
Figure 1.

The levels of the total and HMW adiponectin in the plasma and FF in the IVF women with PCOS and the controls. A demonstrates the total adiponectin and B demonstrates the HMW adiponectin levels; overall, among the women with PCOS, both were significantly decreased in the plasma (White Box) and the FF (Black box) (P < 0.001 and P = 0.002, respectively) in comparison to controls. Compared with the plasma HMW adiponectin levels (White Box), the HMW adiponectin levels in FF (Black box) were significantly lower in the PCOS group and the control group (P = 0.007 and P = 0.002, respectively). The data are the means ± SEM. The P-value for the Wilcoxon and Mann–Whitney U tests for the difference between the two groups.
