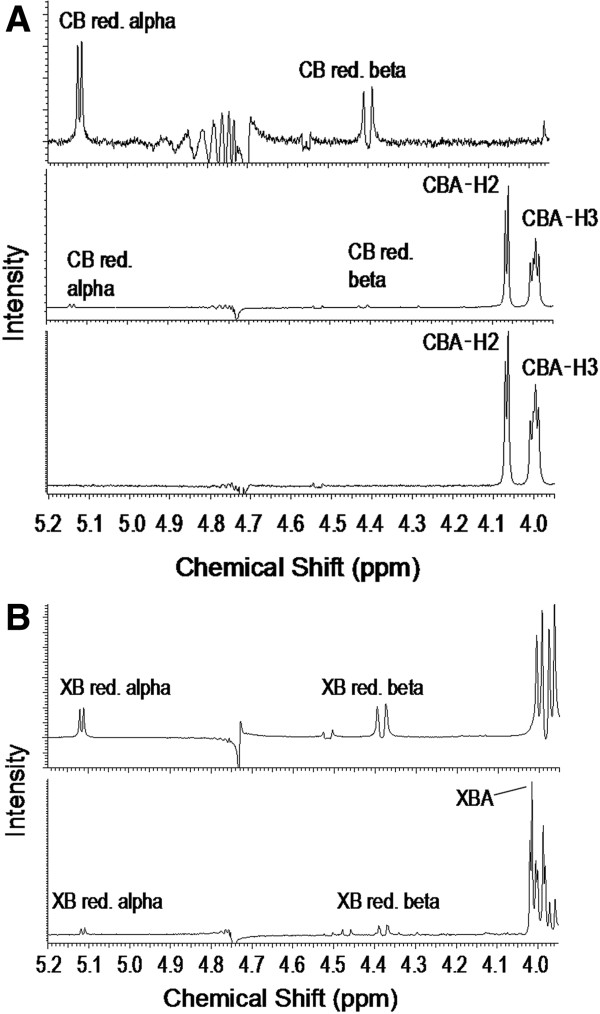
Figure 3.
NMR spectra of cellobiose (A) and xylobiose (B) oxidation. (A): From top to bottom are the spectra of cellobiose, cellobiose that was oxidized by GOOX-VN, and cellobiose oxidized by Y300A; CB red. alpha and CB red. beta: H1 signals due to reducing α-glucose and reducing β-glucose units of cellobiose, correspondingly; CBA-H2 and CBA-H3: H2 and H3 signals of the cellobionate molecule. (B): From top to bottom are the spectra of untreated xylobiose and GOOX-VN oxidized xylobiose; XB red. alpha and XB red. beta: H1 signals due to reducing α-xylose and reducing β-xylose units of xylobiose, correspondingly; XBA: Overlapped signals of the xylobionate molecule (H2 and H3 signals were not well separated from other signals). 10 mM cellobiose and 10 mM xylobiose were used in oxidation reactions.

