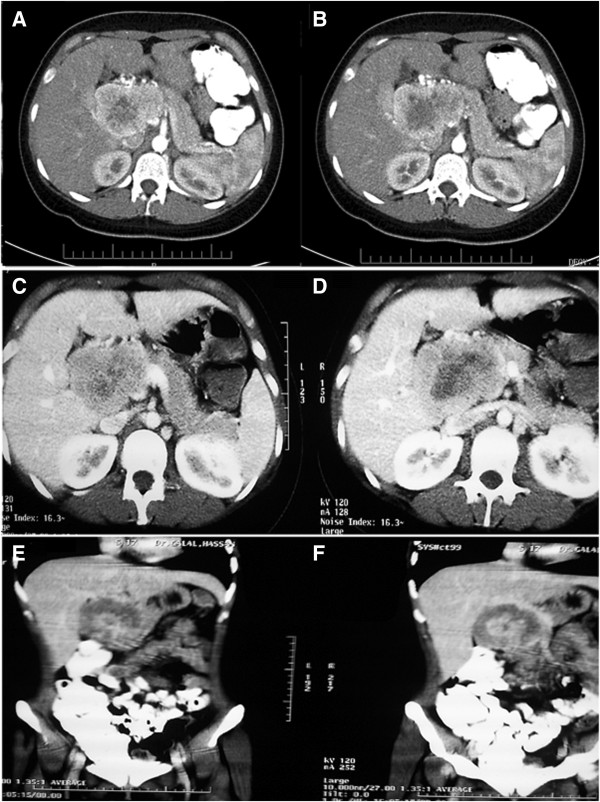
Figure 1.
A computed tomography scan demonstrating a large, well defined pancreatic mass. A-D shows the mass in the pancreatic head and ancinate process with marked enhancement in the arterial phase. E-F: The lesion was anterior to the aorta and inferior vena cava, anteromedial to the right kidney, abutting the fundus of the gall bladder, and reaching the level of porta hepatis.

