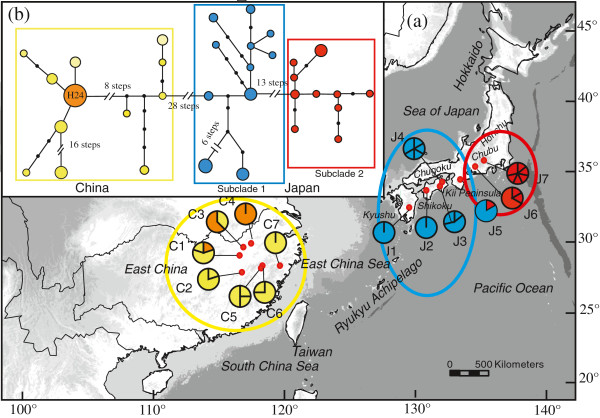
Figure 1.
Distribution of ITS ribotypes and the 95% plausible network of ribotypes in Platycrater arguta. (a) Distribution of ITS ribotypes. All ribotypes, except for H24 denoted by orange colour, are population-specific, and represented with different colours corresponding to the major phylogroups. Population codes are identified in Additional file 1: Table S1. (b) TCS-derived network of genealogical relationships between the 33 ribotypes. The small, solid black circles represent missing ribotypes. The sizes of circles are approximately proportional to sample size (n), with the smallest circles representing n = 1 and the largest representing n = 10.

