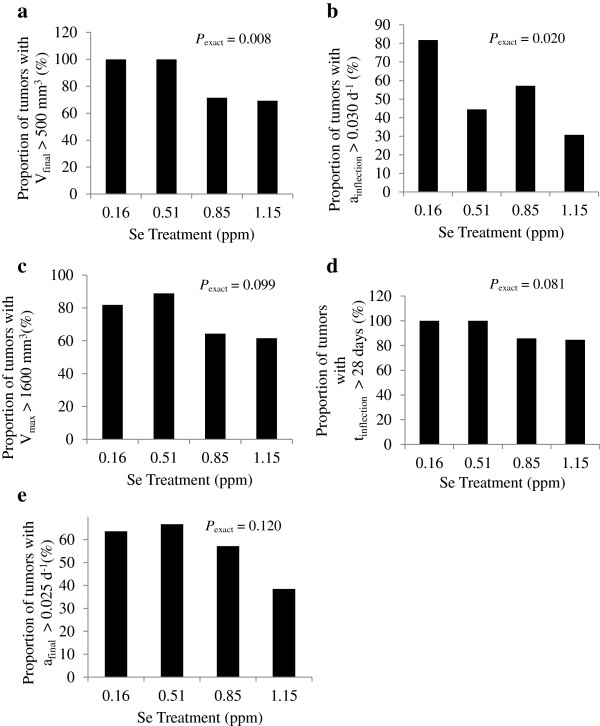
Figure 1.
Proportion of large and fast-growing tumors within each treatment group. Proportion of tumors within each Se-casein treatment with a) final volume above 500 mm3, b) maximum growth rate above 0.03 d-1, c) maximum volume (Vmax) above 1600 mm3, d) inflection point after 28 days, and e) final growth rate above 0.025 d-1 were subjected to an exact Cochran-Armitage test for linear effect of dietary Se level. P-values are shown as Pexact.

