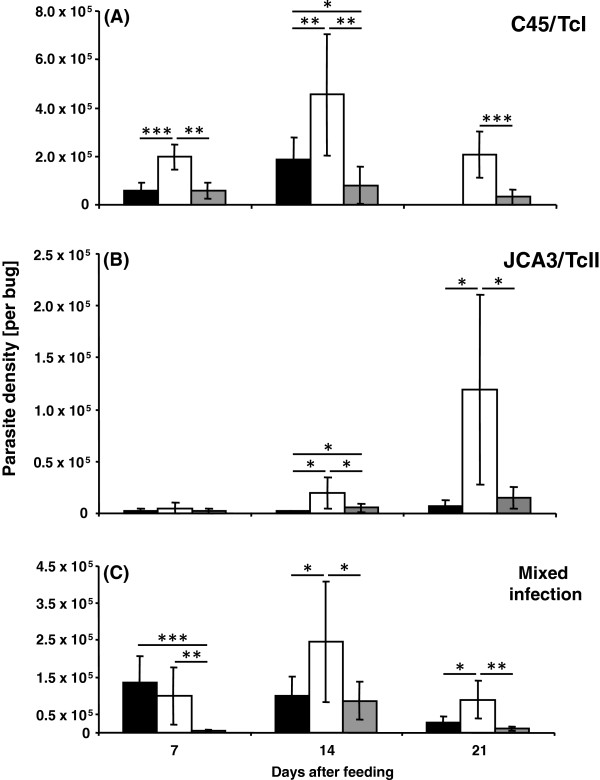
Figure 1.
Mean number of parasites of two different T. cruzi isolates in three intestinal regions (small intestine – black column; rectal lumen – white column and rectal wall – grey column) of R. prolixus (per bug) at different times after blood meal in single C45/TcI (A), JCA3/TcII (B) and mixed infection (C). Standard deviation is shown for each analysed group. Statistically significant differences (* p < 0.05, ** p < 0.01, *** p < 0.001) are shown above the columns. (n = 10).

