Figure 4.
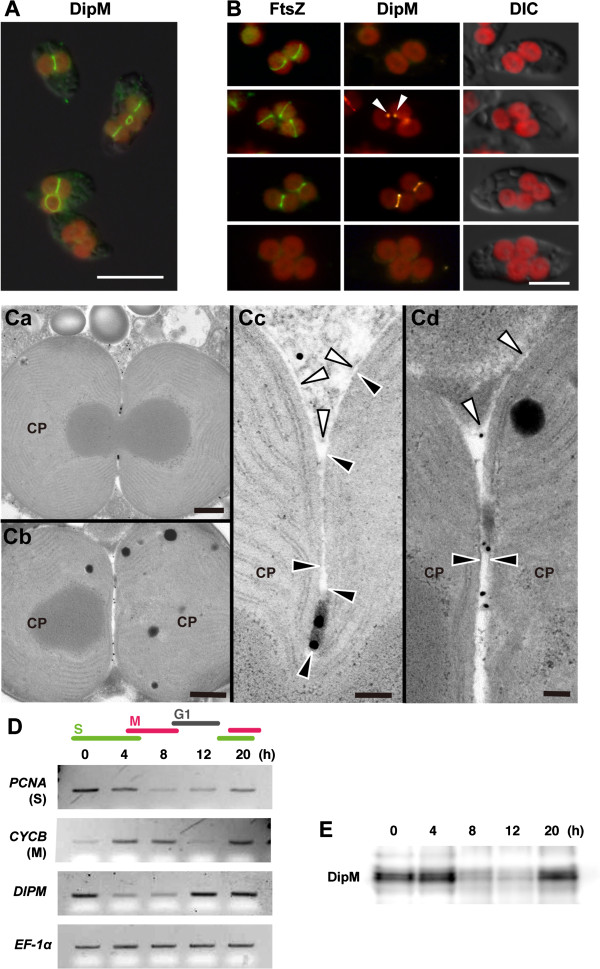
DipM is preferentially expressed in the S phase and localizes at the chloroplast division site in the intermembrane space in the glaucophyte alga C. paradoxa. (A) Immunofluorescent images showing DipM localization at the chloroplast division site (the green fluorescence) in C. paradoxa. The red color is the autofluorescence of chlorophyll. (B) Immunofluorescent images showing FtsZ (the green fluorescence) and DipM (the yellow fluorescence) localization in C. paradoxa. DipM localizes at the division site after FtsZ ring formation. (C) Immunoelectron micrographs showing the localization of DipM at the PG layer at the chloroplast division site. The gold particles indicate the location of DipM. The white and black arrowheads indicate the outer and the inner envelope membranes of the chloroplast (CP), respectively. (D) Semiquantitative RT–PCR analyses showing the change in the mRNA level of DIPM during synchronous culture. DIPM mRNA level peaks during the S phase. The chloroplast division genes are boxed. EF-1α was used as the quantitative control. PCNA and CYCB were used as the S- and M-phase markers. Cells were arrested in the S phase with aphidicolin (an inhibitor of DNA polymerase) and then the cell cycle was restarted under continuous light along with the removal of aphidicolin, as described (Miyagishima et al., [32]). (E) Immunoblot analysis showing the change in the level of the DipM protein during synchronous culture. DipM protein level peaks during the S phase. Equal amounts of total protein were loaded in each lane. Scale bar = 10 μm (A), 5 μm (B), 500 nm (Ca and Cb), 100 nm (Cc and Cd).

