
Figure 10.
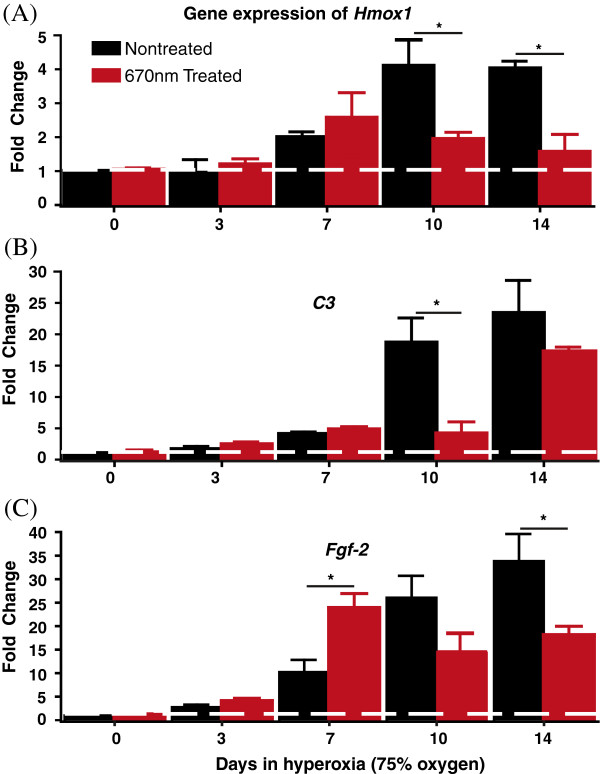
Quantitative gene expression analyses. (A-C) Differential expression profiles of oxidative stress-inducible (A)Hmox-1, (B) proinflammatory C3 and (C) neuroprotectant Fgf-2 mRNA transcripts were measured using real time quantitative PCR. cDNAs from NT (black bar) and 670 nm-Tr (red) C57BL/6J retinas exposed to 0d, 3d, 7d, 10d 14d hyperoxia were used for quantitative analysis. The results were averaged from three independent experiments. The broken horizontal white line represents the fold change (FC) of 1 which means no change in the gene expression. The fold change of >1 represents gene upregulation while FC < 1 indicates downregulation. *Statistically significant difference (p < 0.05) between groups highlighted by the solid black horizontal line.