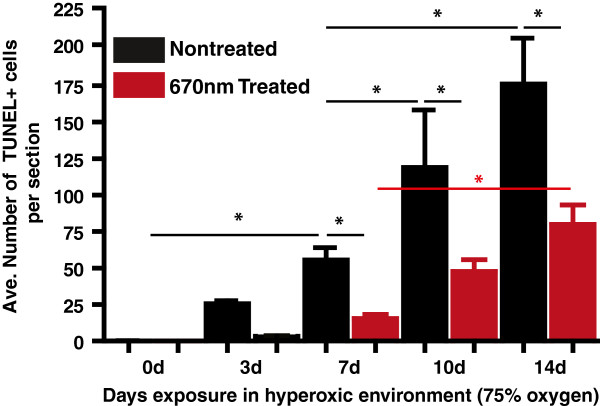
Figure 6.

Quantitative analysis of the average total number of TUNEL + cells. Total counts of TUNEL + photoreceptors across the entire section of NT (black bar) and Tr (red bar) retinas from 0d, 3d, 7d, 10d and 14d groups. *Statistically significant difference (p < 0.05) between groups marked with black or red lines.
