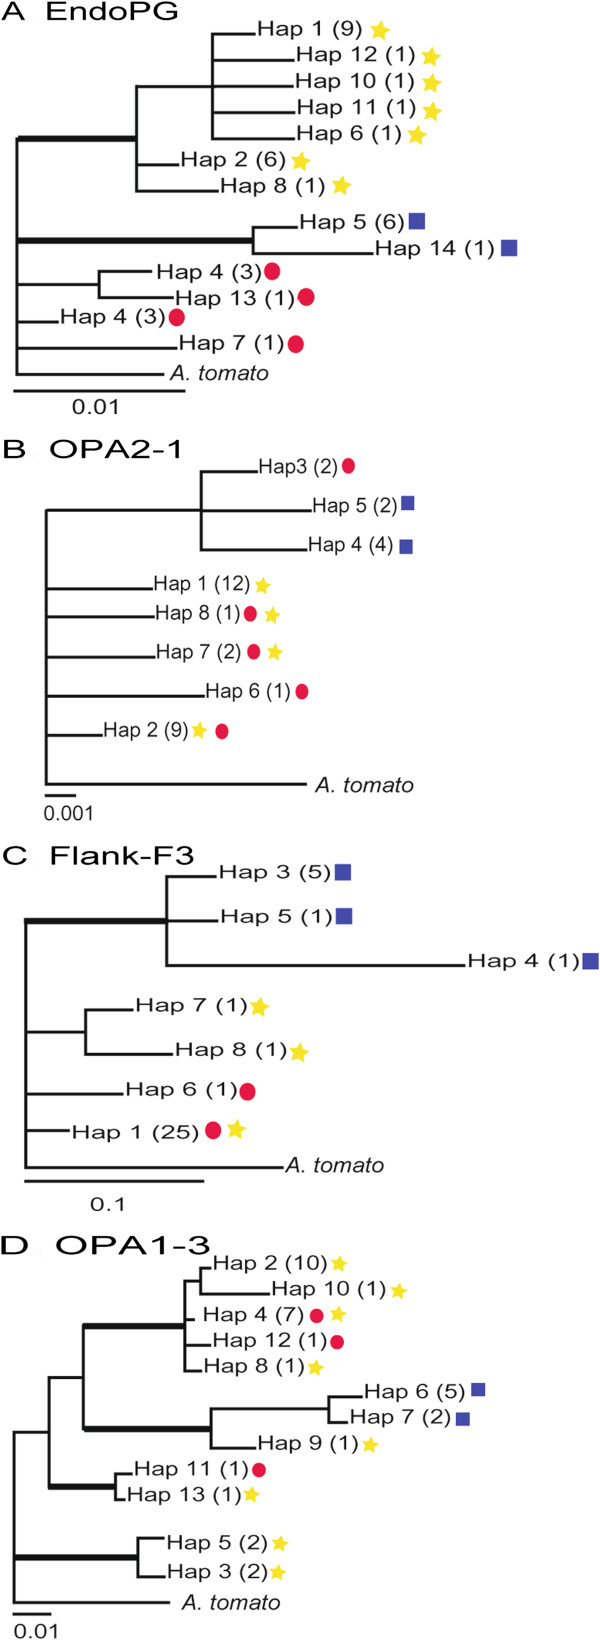
Figure 4.
Bayesian phylogenies estimated for each locus, (A)endoPG, (B) OPA2-1, (C) Flank-F3, and (D) OPA1-3. Bold branches highlight nodes that were supported by 70% bootstrap values (maximum likelihood, 1000 replications) and 95 posterior probabilities. Numbers in parentheses represent the number of isolates of each haplotype. EndoPG haplotypes sampled from the citrus 1, citrus 2 and citrus 3 phylogenetic lineages are indicated by red circles, blue squares, and yellow stars, respectively.

