
Figure 11.
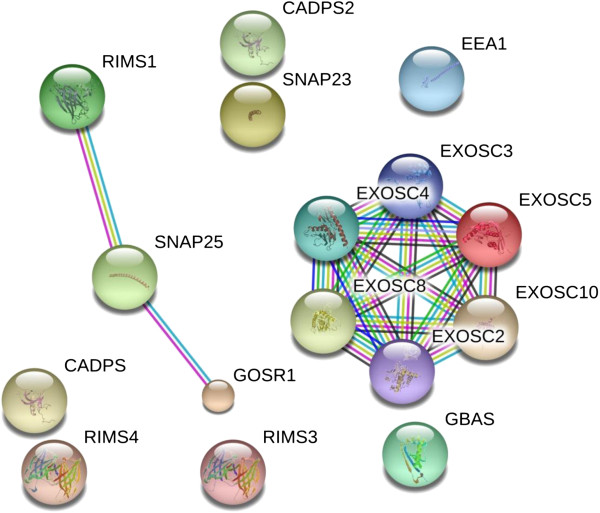
The contents of the database were queried for secretion-associated proteins and are shown without filtering. The full list of protein may be found in Additional file 4. The figure was produced using STRING evidence view. Colors: Green gene neighborhood; red gene fusion; blue concurrence; black co-expression; purple experiments; cyan databases; yellow text mining; and grey homology.