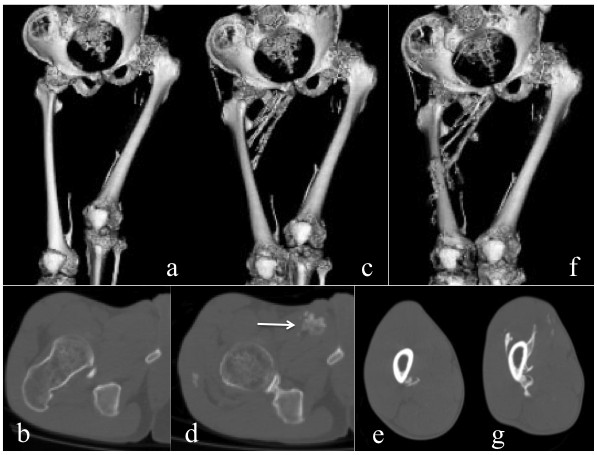
Figure 3.

CT images from Case 2. Reconstructed 3D-CT images of the pelvis and bilateral femora at baseline (a), at M-12 m (c), and at D-12 m (f). Axial CT images of the right hip at baseline (b), and at M-12 m (d), and those of the right mid-femur at M-12 m (e), and at D-12 m (g). Heterotopic ossifications in the right adductor muscle (arrow) developed during the medication phase and around mid-femur developed during the discontinuation phase ware clearly demonstrated.
