Figure 3.

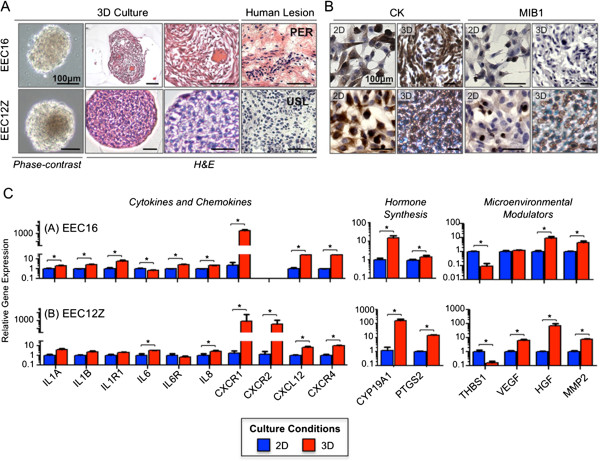
Histological and molecular characterization of 3D EEC models. (A) After 7 days of 3D culture, EEC12Z and −16 both form dense, smooth and symmetrical spheroids. H&E staining indicates that the spheroids are highly cellular. EEC spheroids are similar to human endometriosis lesions in the uterosacral ligament (USL) and the peritoneum (PER). (B) Immunohistochemical staining of EECs in 3D. Cytokeratin expression is increased in 3D versus 2D. For EEC16, MIB1 expression decreased in 3D compared to 2D. In EEC12Z, MIB1 expression in increased in 3D versus 2D. (C) Expression of genes relevant in endometriosis in EEC16 and EEC12Z after culture in 3d for 7 days. *P > 0.05, Two-Tailed Student’s T-Test. Expression is displayed relative to the expression of each gene in 2D. Expression of EGF and FGF9 was also examined and showed no significant change in 2D and 3D cultured EECs (data not shown).
