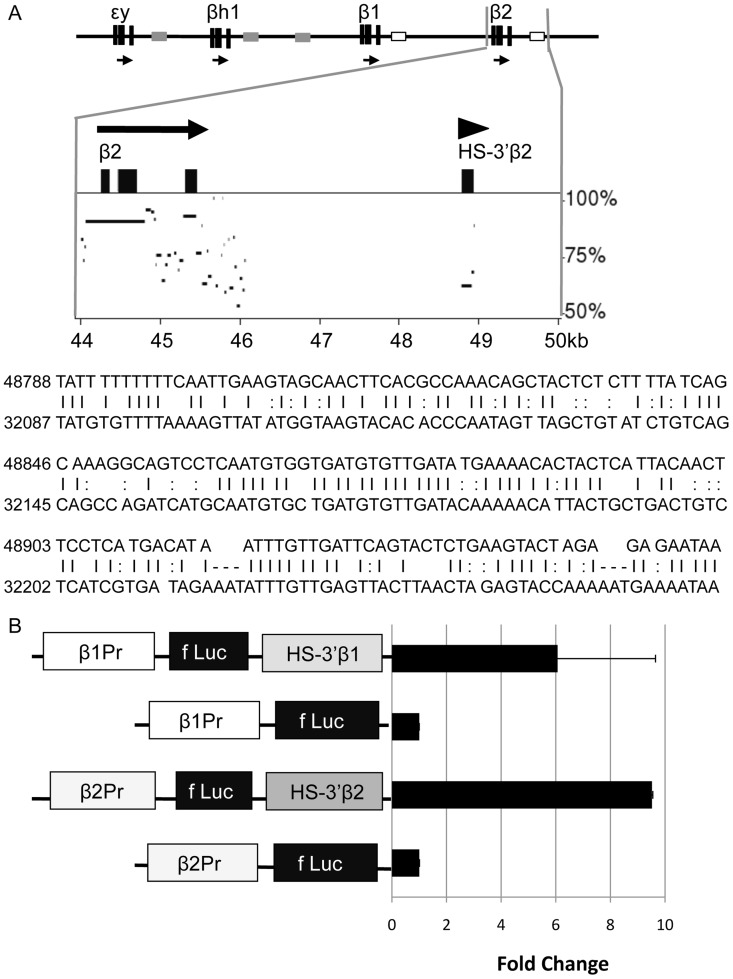
Figure 3. Identification of novel enhancers downstream of the adult murine β-globin genes.
A. Sequence homology between HS-3′β1 and HS-3′β2. The murine β-globin locus is shown at the top, with the region near the β2-globin gene expanded beneath it. The locations of the 3′β1 and 3′β2 enhancers are indicated by open boxes. The graph represents a similarity plot for the region indicated as compared to the region near the β1-globin gene, generated by Pipmaker [27]. Beneath this, the sequences of both regions are shown to illustrate the homology. B. Transient transfection analysis of HS-3′β1 and HS-3′β2. The basic arrangement of sequences – gene promoter (derived from the β1- or β2-globin genes), firefly luciferase cDNA, and candidate enhancer – is shown on the left. The bar graph shows the results of luciferase assays performed on extracts of MEL cells transfected with the indicated constructs after 48 hrs. To normalize, the fluorescence measured for the enhancerless constructs was set as 1.0.

