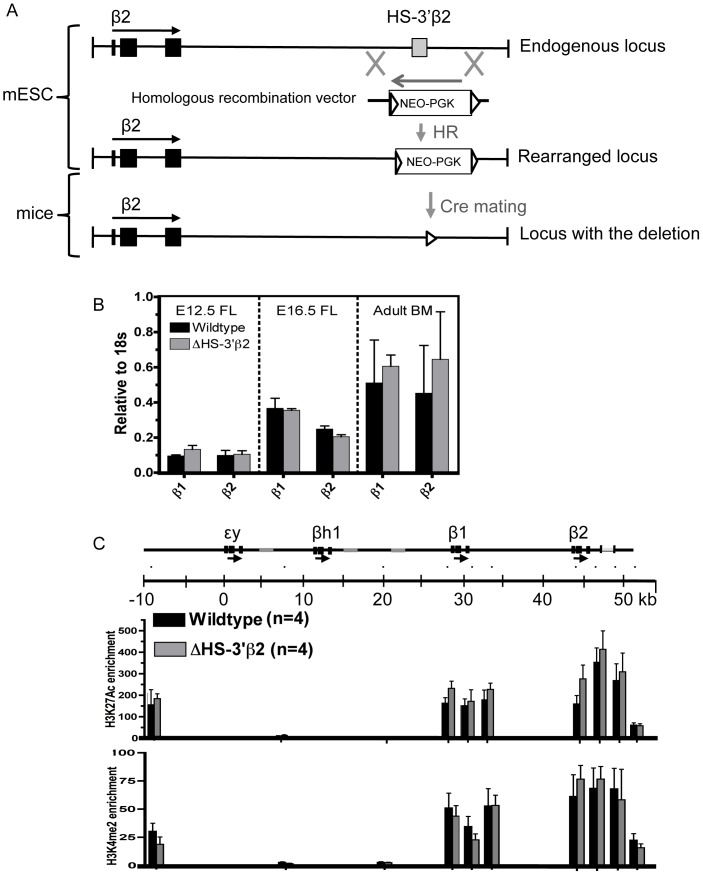
Figure 4. Deletion of HS-3′β2.
A. Schematic showing the strategy for deletion of HS-3′β2, as in Fig. 2A. The region defined as HS-3′β2 – by HS mapping, sequence homology with HS-3′β1 and activity in the transient transfection assay – is indicated by the gray box. B. Analysis of gene expression. Bar graphs show expression of the indicated genes at the indicated timepoints as in Fig. 2B. FL = fetal liver, BM = bone marrow. C. Analysis of histone modifications. Bar graphs show fold enrichments for the indicated histone modifications at the indicated positions within the β-globin locus as in Fig. 2C.

