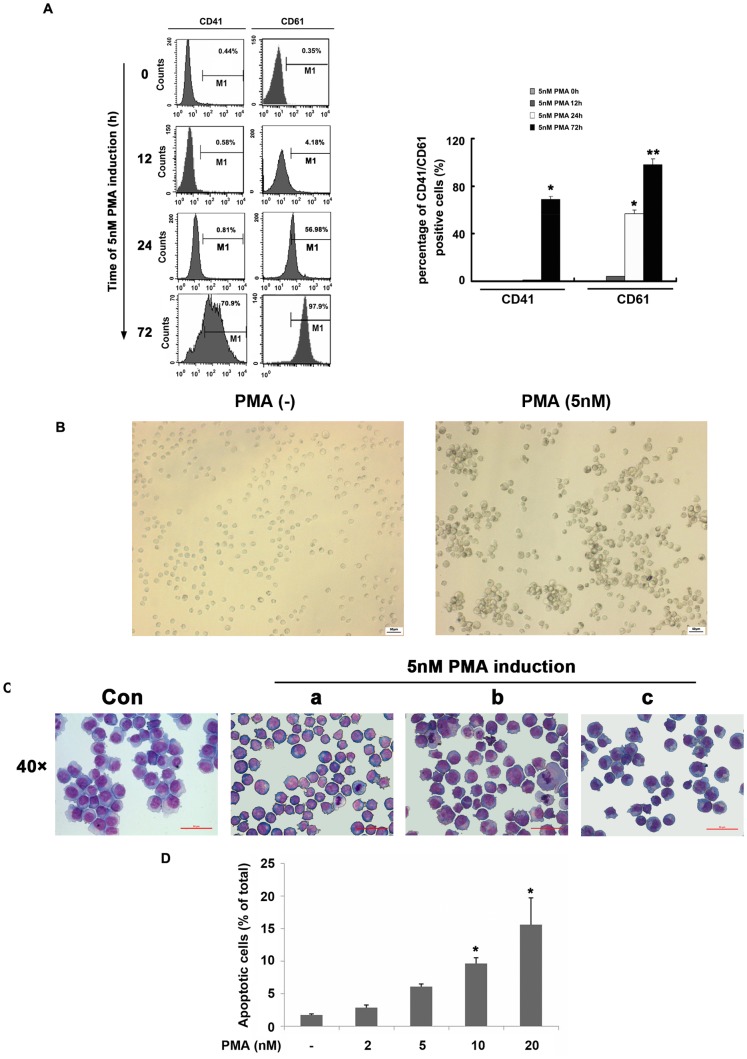
Figure 1. The optimization of the PMA-induced megakaryocytic differentiation in K562 cells.
(A) K562 cells were incubated with 5 nM PMA for the indicated time and then the expression of CD41 and CD61 were analyzed by flow cytometry. (B) Cell morphology was observed by microscope. Scale bars represent 50 µm. (C) Megakaryocytic differentiation was detected by modified Wright-Giemsa staining for cell morphology. Representative cytological changes at 72 h, such as increase in nuclear-to-cytoplasm ratio (a), larger cells (b), and polylobulation nucleus (c) were denoted. Scale bars represent 50 µm. (D) K562 cells were induced with different concentration PMA for 72 h. Cell apoptosis were detected by flow cytometry. All graphics represented means ± SD obtained from three independent experiments, *p≤0.05, **p≤0.001.

