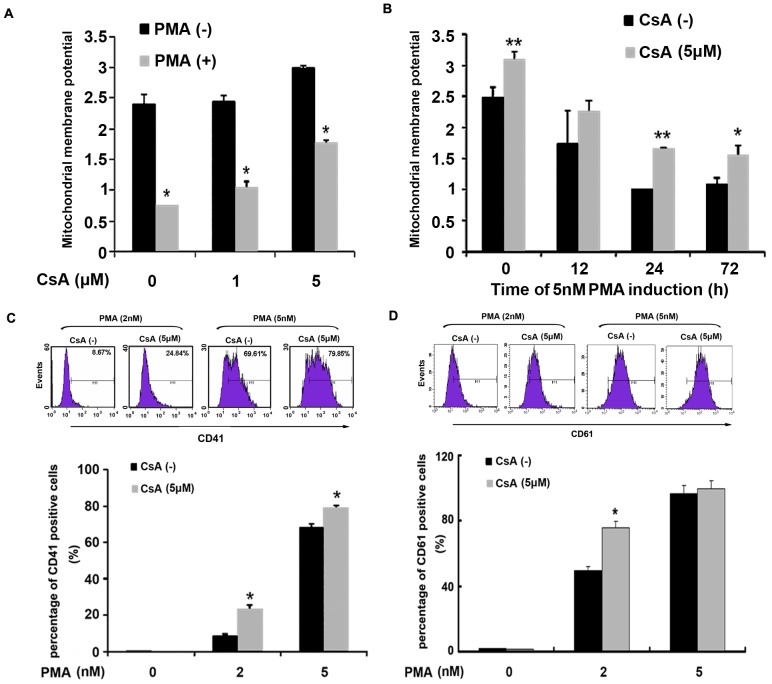
Figure 4. Stability of mitochondrial membrane potential promoted the PMA-induced K562 cell differentiation.
(A) K562 cells were pre-treated with different doses of CsA for 6 h. After the supernatant was replaced by fresh medium without CsA, cells differentiation was induced by 5 nM PMA for 72 h. The mitochondrial membrane potential (JC-1 staining) was determined by flow cytometry analysis. (B) K562 cells were pre-treated with 5 µM CsA for 6 h, and then induced by 5 nM PMA and harvested at 12 h, 24 h and 72 h respectively. Mitochondrial membrane potential (JC-1 staining) was determined by flow cytometry analysis. (C & D) After pre-treatment by 5 µM CsA, K562 cells were induced using 2 nM or 5 nM PMA for 72 h, expression of CD41 and CD61was determined by flow cytometry analysis. All graphics represented means ± SD obtained from three independent experiments, *p≤0.05, **p≤0.001.

