Figure 3.

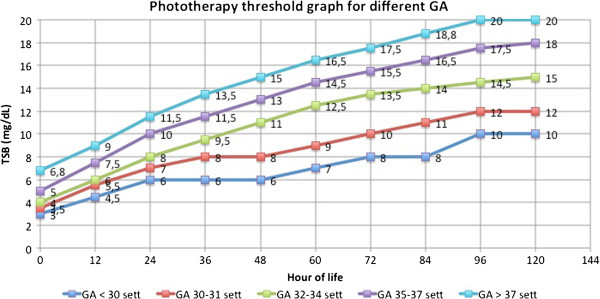
The graph shows the thresholds for phototherapy. Total bilirubin was plotted against age in hours. The groups of GA were represented with different lines.

The graph shows the thresholds for phototherapy. Total bilirubin was plotted against age in hours. The groups of GA were represented with different lines.