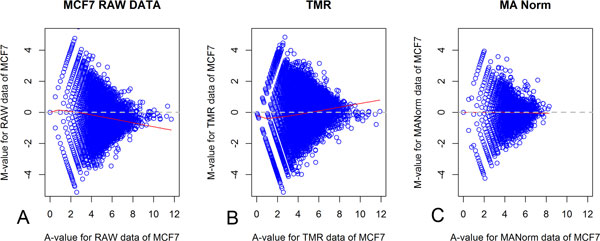
Figure 1.

Comparison of raw data, TMR and LOWESS MA normalization of PolII data. We applied different normalizations to PolII binding quantity data from all chromosomes of MCF7 cell line. Chr5 is used here as an example. (A) Raw data with a clear bias toward the negative direction; (B) data normalized through the TMR method, with a clear bias toward the positive direction; (C) data normalized through the LOWESS MA method with respect to a mean of 0. Red lines represent the LOWESS smoother line with respect to the mean, and grey (dotted) lines represent the zero-difference line.
