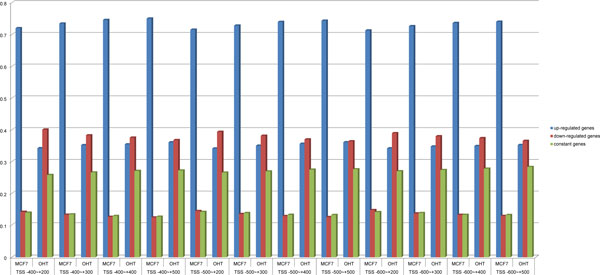
Figure 4.

Significant differences were found in PolII binding patterns between MCF7 and OHT cell lines. We defined the variance of PolII binding quantity as follows: no more than +-2.5% of the average of PolII binding quantity before and after E2 stimulation indicated that PolII binding mode was constant; more than +2.5% of the variance in PolII binding quantity indicated that the gene was up-regulated, and less than -2.5% of the variance indicated that it was down-regulated. The percentages of up-regulated, down-regulated and constant genes identified based on PolII binding quantities in all 12 areas around the 34,055 TSSs of genes in MCF7 and OHT cells when stimulated by E2 appeared to be significantly different. This finding implies great difference between the transcriptional regulation modes of two cell lines.
