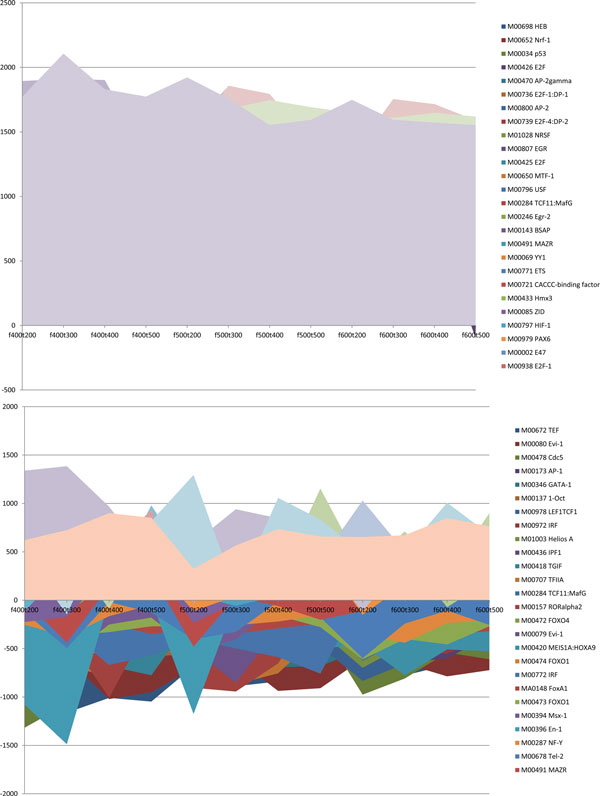
Figure 7.
Comparisons of TF regulatory ability between each interval in MCF7 and OHT cells. The horizontal axis represents different intervals, and the vertical axis represents regression coefficient, which reflects the signal intensities of regulatory TFs. The regulatory intensities of TFs such as c-Myc; GATA-2 in MCF7; and Evi-1 and YY1 in OHT were so large over all of the regions that the signal fully submerged those smaller regulatory signal intensities of other TFs.

