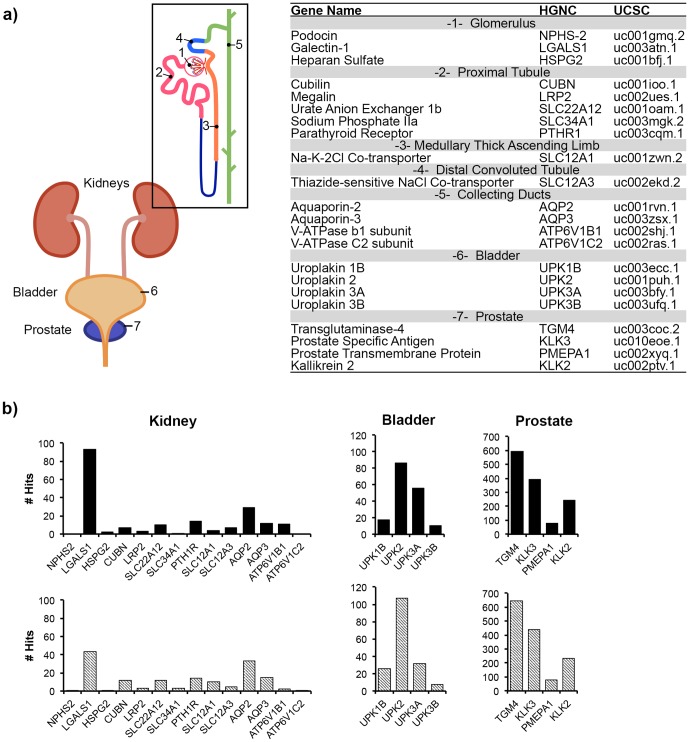
Figure 3. Mapping of coding genes to the genitourinary epithelium.
a) Cartoon of the genitourinary system, highlighting specialized regions including the glomerulus (1), proximal tubules (2), medullary thick ascending limb (3), distal convoluted tubule (4), collecting duct (5), bladder (6) and prostate (7). b) The number of deep sequencing reads normalized to gene length were graphed to produce a transcriptional profile for each of the sub-regions of the genitourinary tract (solid bars – +DNase, lined bars – -DNase).

