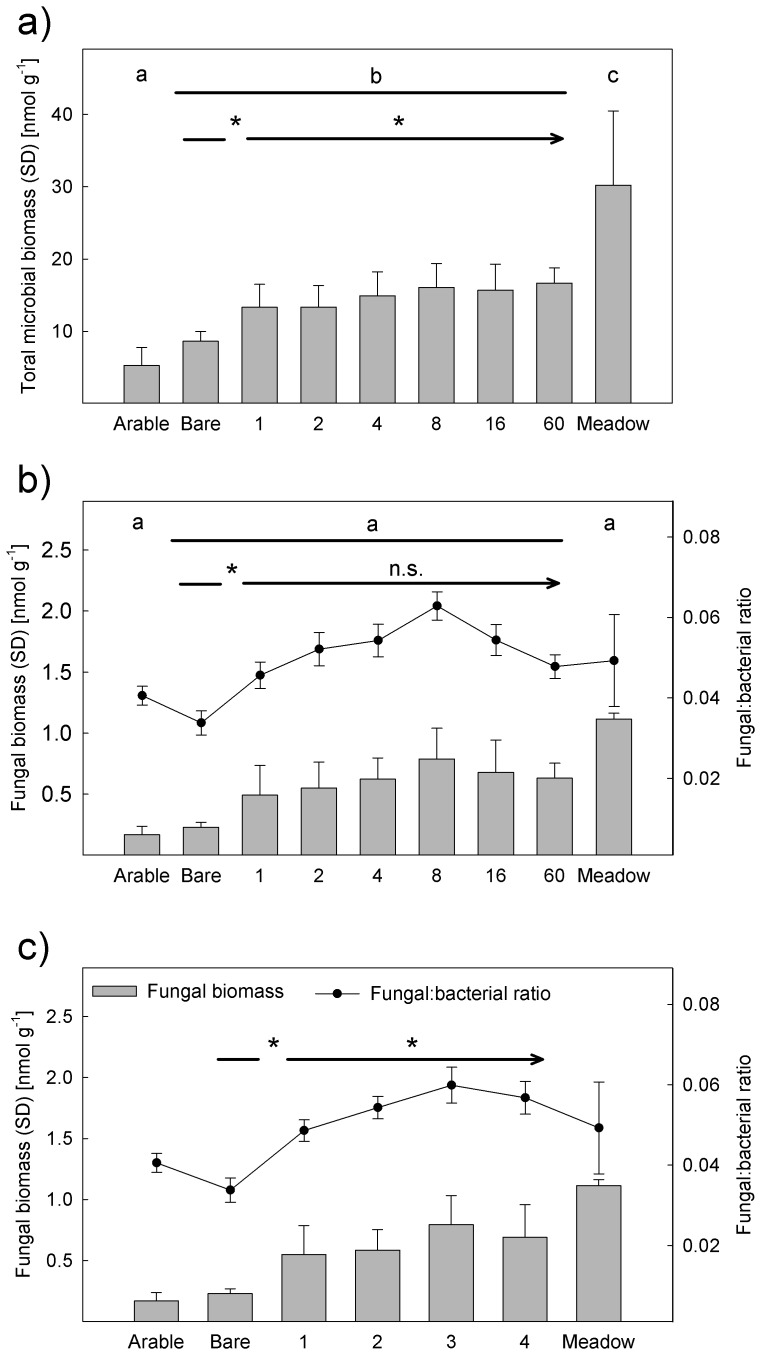
Figure 1. Impact of land use and plant diversity soil microbial community.
Differences (P<0.05) between experimental plots and control sites (arable land and semi-natural meadows) were analyzed with Tukey's HSD test and indicated by letters. Differences between bare ground vs. vegetated plots and significant effects of plant diversity were tested with ANOVA (Table 1) and indicated by asterisks (P<0.05). Figures show effect of plant species richness on (a) total microbial biomass (b) fungal biomass and the fungal-to-bacterial biomass ratio and (c) number plant functional groups effect on fungal biomass and the fungal-to-bacterial biomass ratio.

