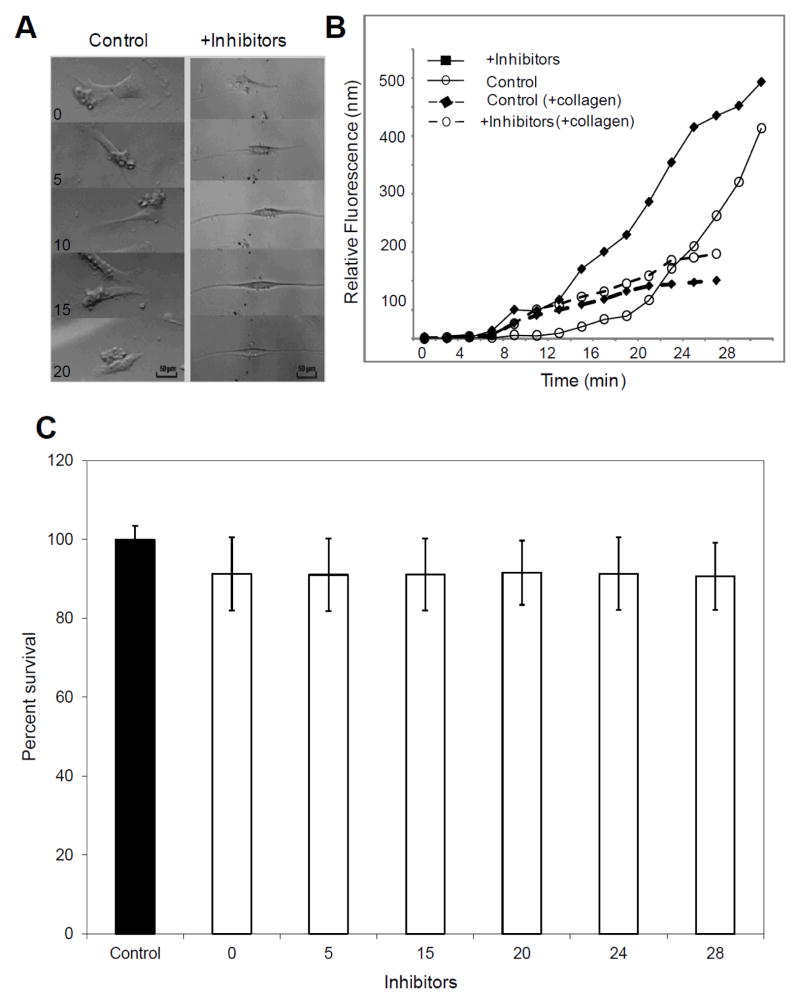
Figure 3.
Effects of inhibitor mediated reduction in glycosylation in vitro (representative data). (A) Representative microscopic images depicting cell morphology in response to inhibitor mediated reduction in protein glycosylation in comparison to controls as indicated in selected hourly time intervals (B) The transport of fluorophore across multilayered ensemble of primary TM cells with or without glycosylation inhibitor treatment on a porous 8 μm membrane, without any collagen embedding (solid lines) and with collagen matrix embedding at each cell layer (dashed lines). (C) The cell survival for primary TM cells were determined for control (filled bars) and inhibitor treated groups at indicated time interval (hollow bars) in hours using Trypan blue exclusion assay. The average± standard deviation of percent of cell survival for indicated groups have been shown.

