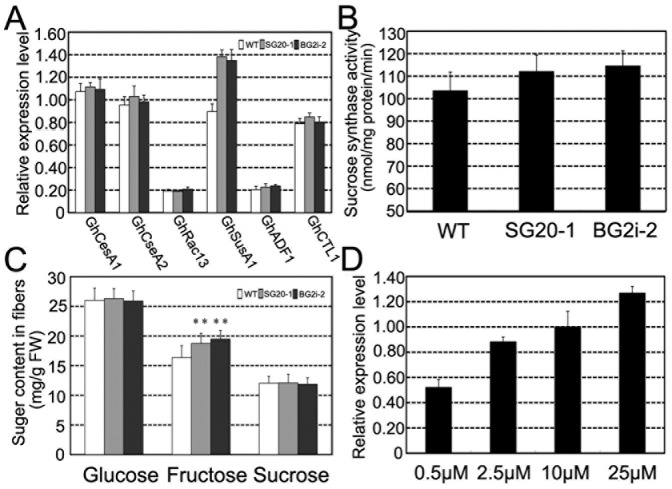
Figure 3. Sucrose synthase expression in GA overproduction cotton fibers.
(A) Quantitative RT-PCR expression analyses of secondary cell wall related genes in 20-dpa fibers. GhCesA1, U58283; GhCesA2, U58284; GhRac13, S79308; GhSusA1, HQ702817; GhADF1, DQ088156 andGhCTL1, AY291285. (B) Sucrose synthase activity in 20-dpa cotton fibers. (C) Sugar contents in 20-dpa cotton fibers, n = 3. Double asterisks (**) represent significant differences (t test) at p = 0.01 compared with the wild type cotton. (D) GhSusA1 expression levels of in vitro cultured fibers treated with GA3 of various concentrations.

