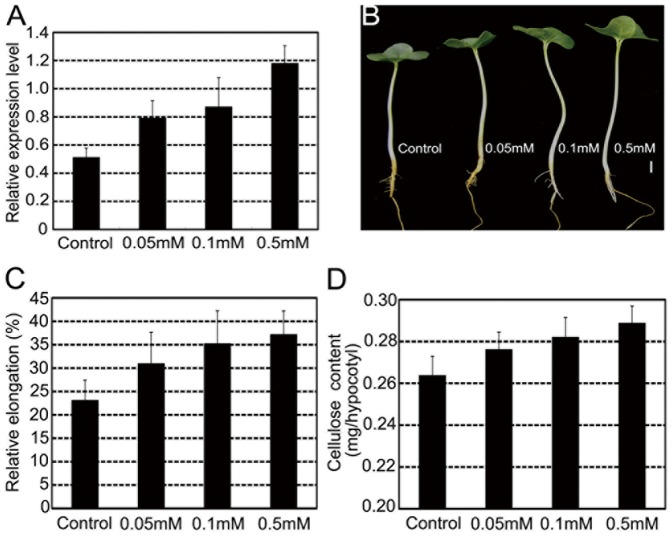
Figure 4. Sucrose synthase expression and cellulose biosynthesis in GA-treated hypocotyls.
Seedlings wereimmersed in distilled water (pH6.0) or GA3 solutions (0.05 mM, 0.1 mM and 0.5 mM, pH6.0).(A) Quantitative RT-PCR analysis of GhSusA1 transcript in hypocotyls. (B) Effects of GA3 treatment on cotton seedling growth. (C) Relative elongation of hypocotyls. (D) Cellulose amount in GA-treated hypocotyls.

