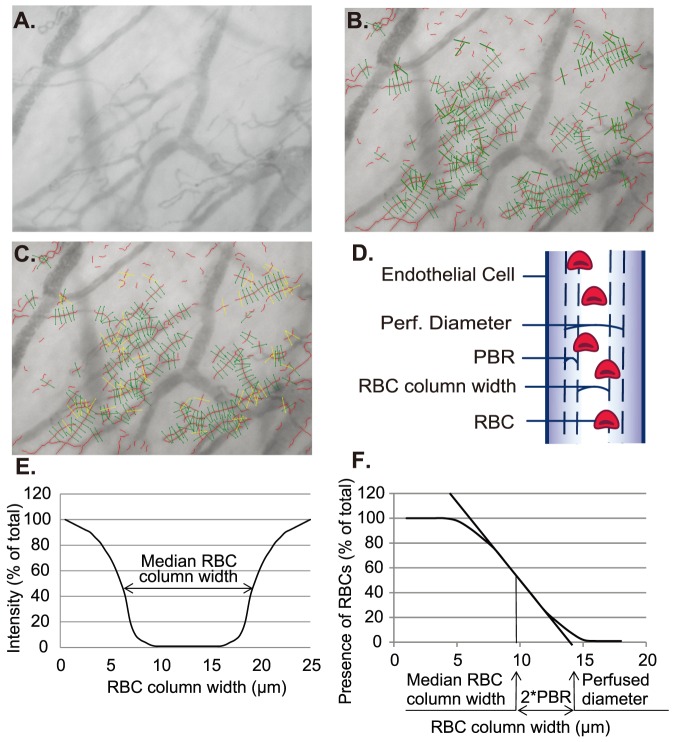
Figure 1. Glycocheck algorithm on endothelial PBR determination and microvascular perfusion properties.
A) Red blood cells (RBC) are detected through reflection of light emitting diodes by hemoglobin. Images captured by the sidestream darkfield camera are sent to the computer for quality checks and assessment. The black contrast is the perfused lumen of the vessels. B) In each recording, the software automatically places the vascular segments (green), every 10 µm along the vascular segments (black contrast). C) After the acquisition, for the analysis, the software undergoes several quality check in the first frame of each recording (see text), to select vascular segments with sufficient quality for further analysis. Invalid vascular segments (yellow) are distinguished from the valid vascular segments (green). During the whole recording session of 40 frames, the percentage of time in which a particular valid vascular segment has RBCs present is used to calculate RBC filling percentage. D) Depiction of the concept of glycocalyx thickness by lateral RBC movement is shown here. E) For each vascular segment, the intensity profile is calculated to derive median RBC column width. F) Then, the distribution of RBC column width is used to calculate the perfused diameter, median RBC column width, and subsequently the perfused boundary region (PBR).

