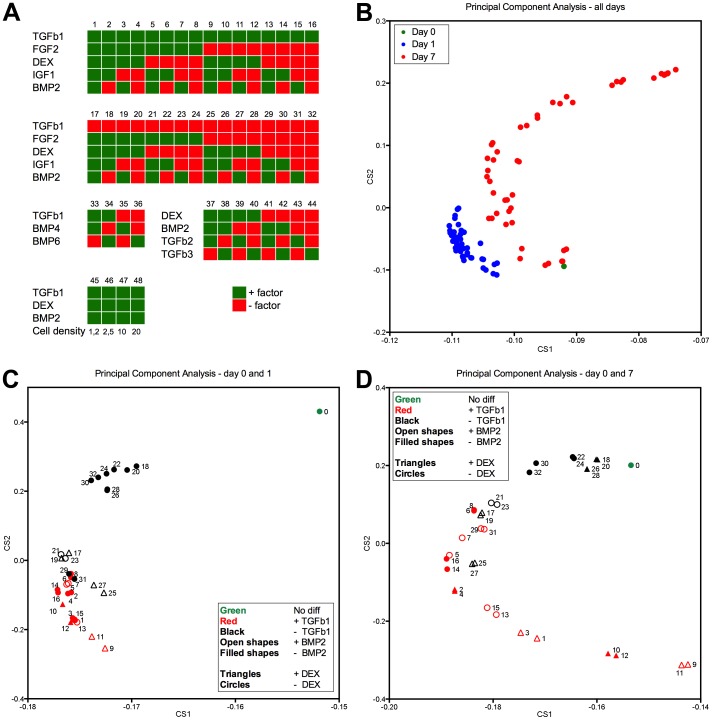
Figure 1. Experimental setup and principal component analysis (PCA).
A. Experimental setup with numbering of the different conditions. When not stated, the cell density was 107 cells per mL. B. PCA on all conditions labelled by days in culture. C. PCA limited to conditions 1–32 on days 0 and 1. D. PCA limited to conditions 1–32 on days 0 and day 7.

