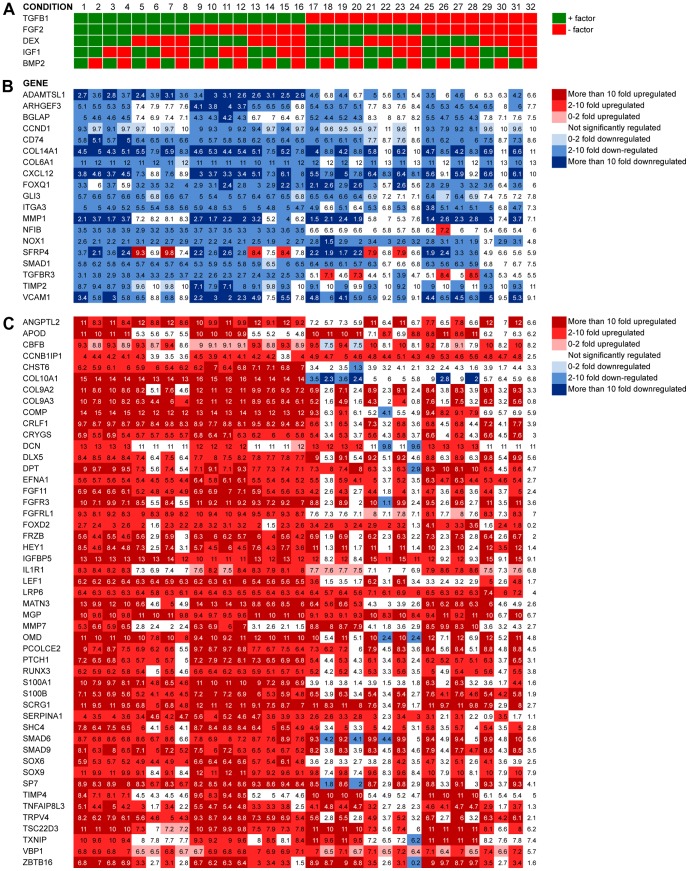
Figure 5. Genes uniformly affected by single factors across conditions 1–32 at day 7.
A. Experimental setup conditions 1–32. B. Heatmap of genes significantly downregulated in all conditions contaning any one of the factors compared to condition 32. C. Heatmap of genes significantly upregulated in all conditions contaning any one of the factors compared to condition 32. Values are log2-transformed mean expressions (n = 3).

