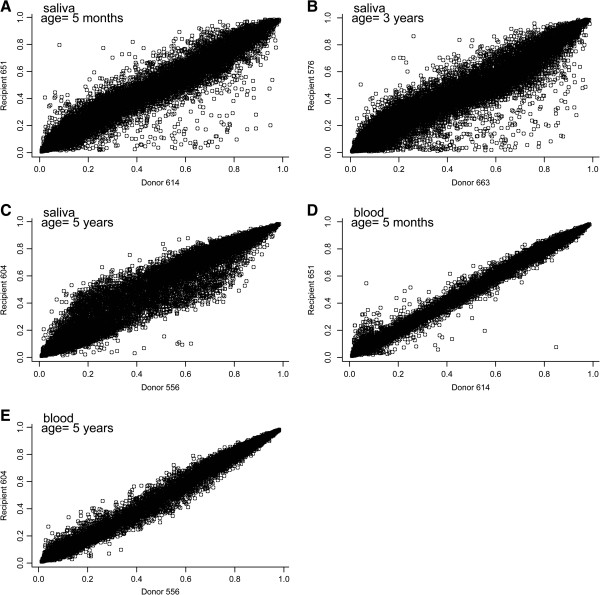
Figure 3.

Scatterplots of autosomal CpG loci DNA methylation relationships between individual donor and recipient twin pairs. Panels A-C each depict a twin pair in saliva with donor twins on the X-axes and recipient twins on the Y-axes, while Panels D-E depict twin pair comparisons of methylation in peripheral blood samples. The ages of the children at the time of sample collection are provided on each panel.
