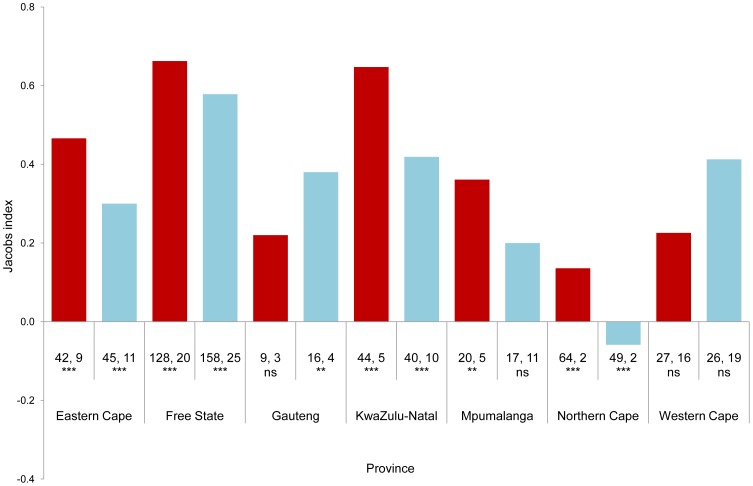
Figure 4. Habitat selection by Secretarybirds observed in the CAR project, with CAR routes grouped by province.
Jacobs index values between –1 and zero indicate selection for transformed habitats, and between zero and +1 indicate selection for natural habitats. Each province is separated into summer (red bars) and winter (blue bars). Numbers below the bars are the number of routes on which Secretarybirds showed a preference for natural or transformed habitats, respectively. These numbers were tested using the sign test and the level of statistical significance is indicated beneath the numbers, as follows: *** for p<0.001, ** for p<0.01 and ns (not significant) for p>0.05.

